Capital city or regional area
Capital cities usually offer broader job markets and services. Regional areas can offer lifestyle or visa-related advantages, but job depth and transport may be narrower.
There is no universally best city. Use this comparison to shortlist places by job sectors, rent pressure, population scale, climate and transport, then verify current data before signing a lease or accepting a job.
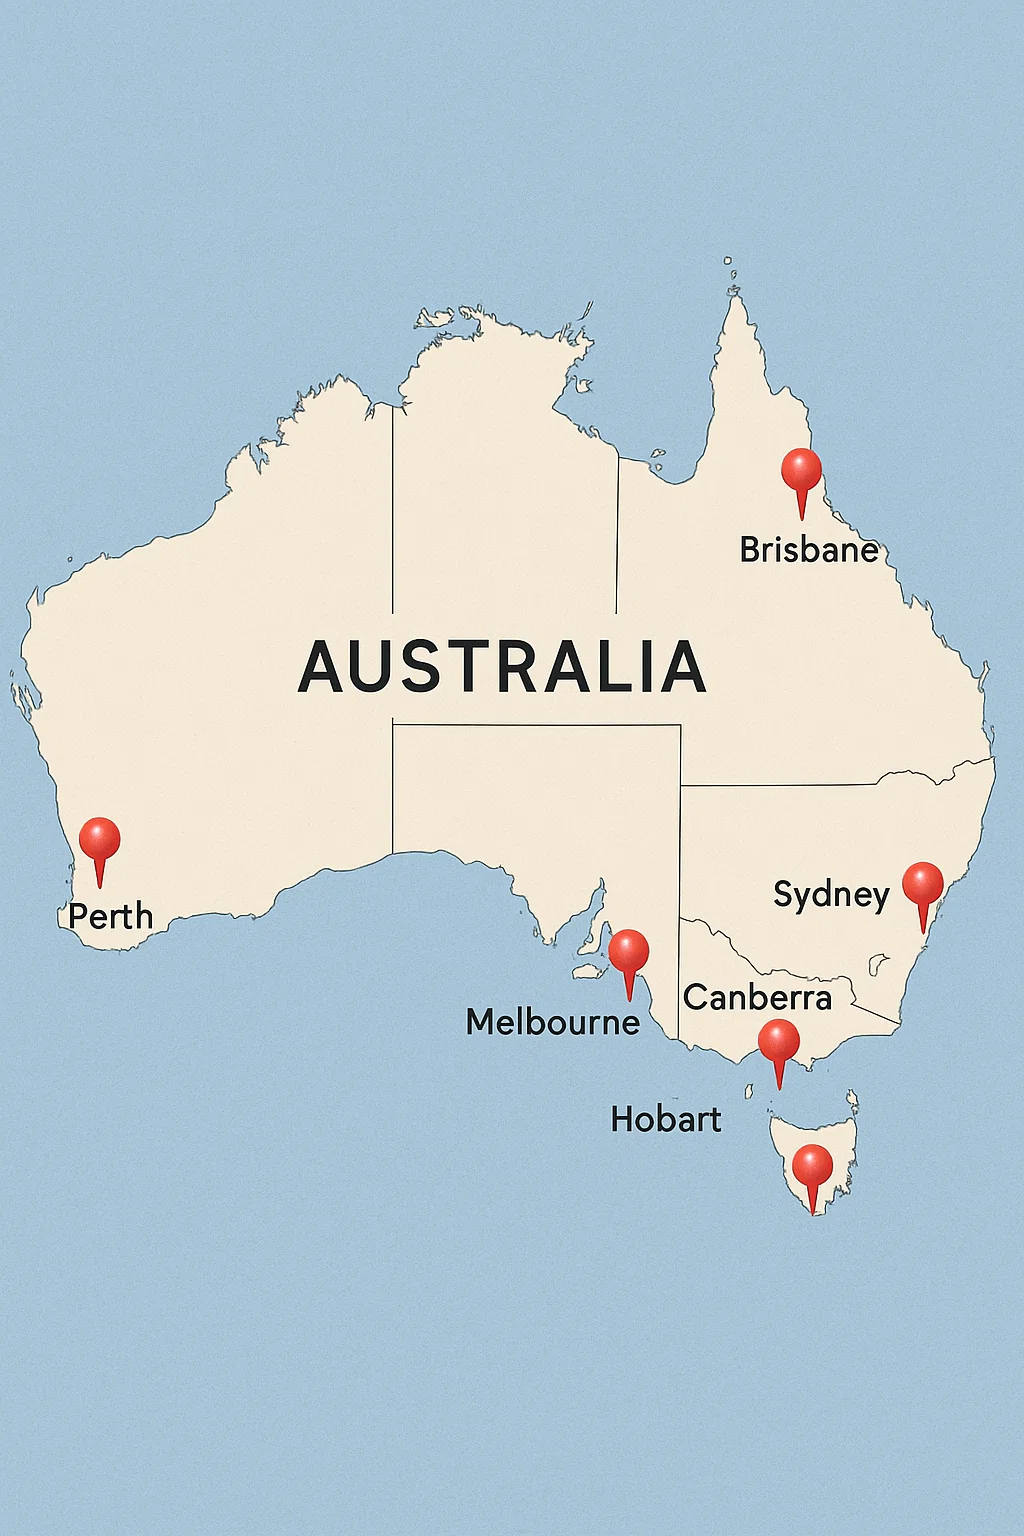
Start with employment fit, then test affordability and commute. A lower-rent city may not be cheaper if the job market is narrow for your occupation, while a high-rent capital may work if income and transport access are stronger.
Period represented: 2024-2026 planning snapshot. Values are broad categories, not live rent quotes or salary promises. Reference periods appear beside changing values.
Showing all eight capital cities.
| Employment sectors | Climate | Public transport | |||
|---|---|---|---|---|---|
| Sydney | High rental pressure; planning label checked July 2026 | Finance, technology, health, education, professional services | 5.56 million, 30 June 2025 | Temperate coastal | Transport for NSW |
| Melbourne | High rental pressure; planning label checked July 2026 | Health, education, technology, construction, professional services | 5.35 million, 30 June 2025 | Temperate and variable | Public Transport Victoria |
| Brisbane | Medium-high rental pressure; planning label checked July 2026 | Health, construction, education, tourism, professional services | 2.71 million, 30 June 2025 | Subtropical | Translink Queensland |
| Perth | Medium-high rental pressure; planning label checked July 2026 | Mining, energy, health, construction, education | 2.38 million, 30 June 2025 | Mediterranean | Transperth |
| Adelaide | Medium rental pressure; planning label checked July 2026 | Health, defence, education, manufacturing, public administration | 1.47 million, 30 June 2025 | Mediterranean | Adelaide Metro |
| Canberra | Medium-high rental pressure; planning label checked July 2026 | Public administration, technology, education, health, professional services | 474,000, 30 June 2025 | Cool temperate inland | Transport Canberra |
| Hobart | Medium rental pressure; planning label checked July 2026 | Health, tourism, education, public administration, agriculture and food | 255,000, 30 June 2025 | Cool temperate maritime | Metro Tasmania |
| Darwin | Variable rental pressure; planning label checked July 2026 | Public administration, defence, health, resources, tourism | 152,000, 30 June 2025 | Tropical savanna | NT Government public bus network |
Capital cities usually offer broader job markets and services. Regional areas can offer lifestyle or visa-related advantages, but job depth and transport may be narrower.
Use live rental sources before choosing a suburb. Compare bond, utilities, transport and inspection competition, not rent alone.
Match your occupation to active sectors and licensing rules. Use Jobs and Skills Australia and state occupation information for current labour-market context.
Check commute from suburb to workplace or campus, especially if you will not buy a car immediately.
The comparison uses public planning indicators, not a fabricated overall ranking. Population uses ABS Greater Capital City Statistical Area estimates where available. Employment sectors are broad planning prompts from official labour-market and state sources, not job guarantees. Rental labels are deliberately qualitative because live asking rents, new-lease medians and census housing costs measure different things and should not be mixed as if they were the same. Climate summaries point readers to Bureau of Meteorology classifications and local climate normals. The dataset is reviewed at least annually and sooner when ABS, labour-market or transport sources materially change.
Missing values are left out rather than inferred. The site does not declare one universally best city because the best choice depends on occupation, visa conditions, study plans, family needs, housing budget, transport needs and climate tolerance.